Immediate implementation of watercell technology will extend the life of existing stormwater infrastructure
The Vision Water WaterCell™ is preserving and conserving the environment by significantly reducing mains water use and peak flow stormwater runoff for every property where it is installed.
Vision Water has been recognised by industry leaders for the development of WaterCell™, a truly sustainable rainwater harvesting system for all types of buildings.
By Dr Steven Lucas and A/Prof Peter Coombes, School of Environmental and Life Sciences, The University of Newcastle
Scenario:
450 m2 lot; 200m2 roof area; 3 person household; 65% impervious area (including roof); in Brisbane, Melbourne and Sydney. These are important factors in urban planning.
Options analysed included
business-as-usual (BAU), 5kL rainwater tank, and WaterCell technology
(64 kL). BAU is the traditional centralised approach (i.e. dams, pumps
and pipes), the 5kL rainwater tank option simulated an above-ground
rainwater tank, and the WaterCell design incorporates 64kL of rainwater
storage (in the floor plan design during construction.
Note:
Water demand data and
climate files were different for each location. Water demand and rainfall
are major variables dictating yield from a rainwater storage of any
size. The table below summarises input data to the Probabilistic Rainfall
and Wastewater Reuse Simulator (PURRS - Coombes, 2002).
Coombes, P. J. (2002).
Rainwater Tanks Revisited: New Opportunities for Urban Water Cycle Management.
PhD Thesis, School of Engineering, University of Newcastle, NSW,
Australia. http://www.eng.newcastle.edu.au/~cegak/Coombes/
| Location | Duration of rainfall file | Occupancy | Average Annual Rainfall (mm/yr) | Water Demand (kL/lot/yr) |
| Brisbane | 83 yrs | 3-person | 1094 | 160.31 |
| Melbourne | 76 yrs | 3-person | 651 | 188.08 |
| Sydney | 86 yrs | 3-person | 1204 | 277.58 |
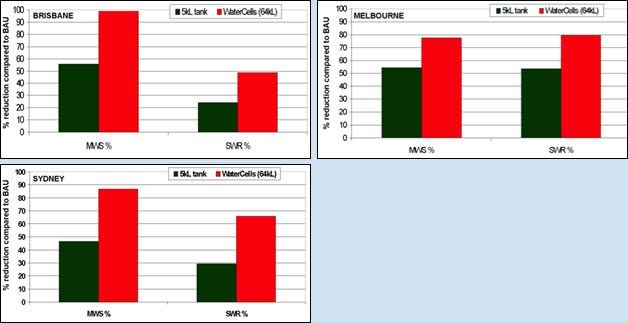
PURRS is currently used
as a research tool, however the creator (Peter Coombes) and the model
are very well known in the water industry (government, water authorities
and consultants). The Figures below summarise mains water savings (MWS%)
and stormwater runoff (volumes) reduction (SWR%) at the household scale
(when compared to BAU).
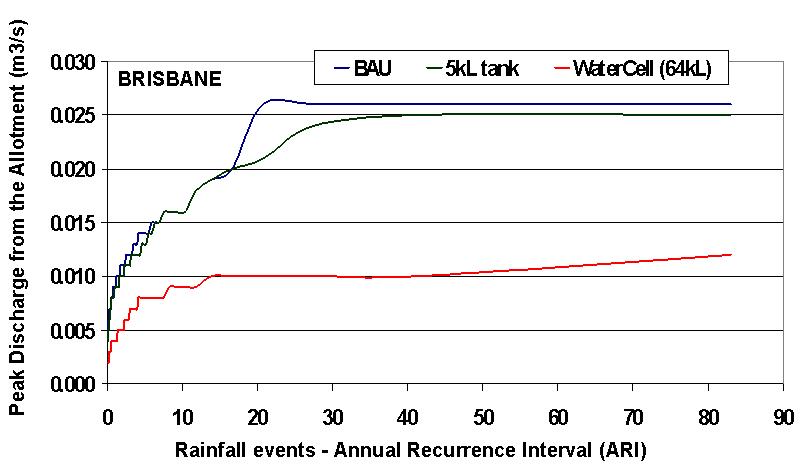
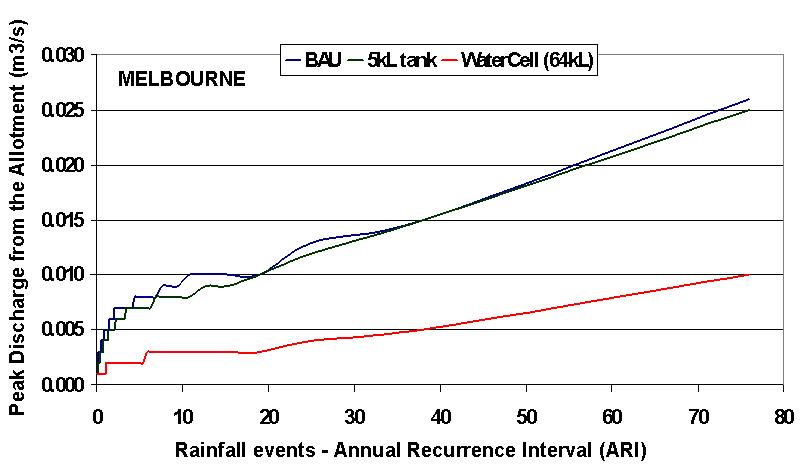
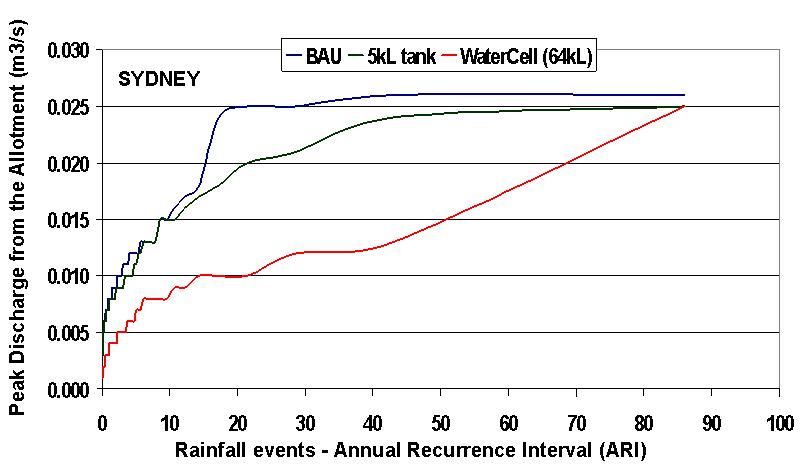
The Figures (on the following page) show the impact of WaterCell technology in reducing peak stormwater discharges (in m3/s) from the allotment.
The reduction in peak stormwater discharge (m3/s
from the allotment) is shown for a range of annual recurrence intervals
(i.e. 1 in 10 year event, 1 in 50 year event, etc). Significant reductions
in peak discharge can be seen when WaterCells are incorporated into
the house design. This has potential for offsetting infrastructure costs
when considering investment for “downstream” stormwater management
strategies.
Keep up-to-date with industry news and intersting rainfall stats. Sign up to our newsletter.
(02) 4304 4600
Suite 2, Level 2, 10 William St Gosford, NSW 2250 Australia
Web Design & SEO
by Big Click Studios


Copyright © 2008
www.vision-water.com
All rights reserved.
ABN: 68116811780